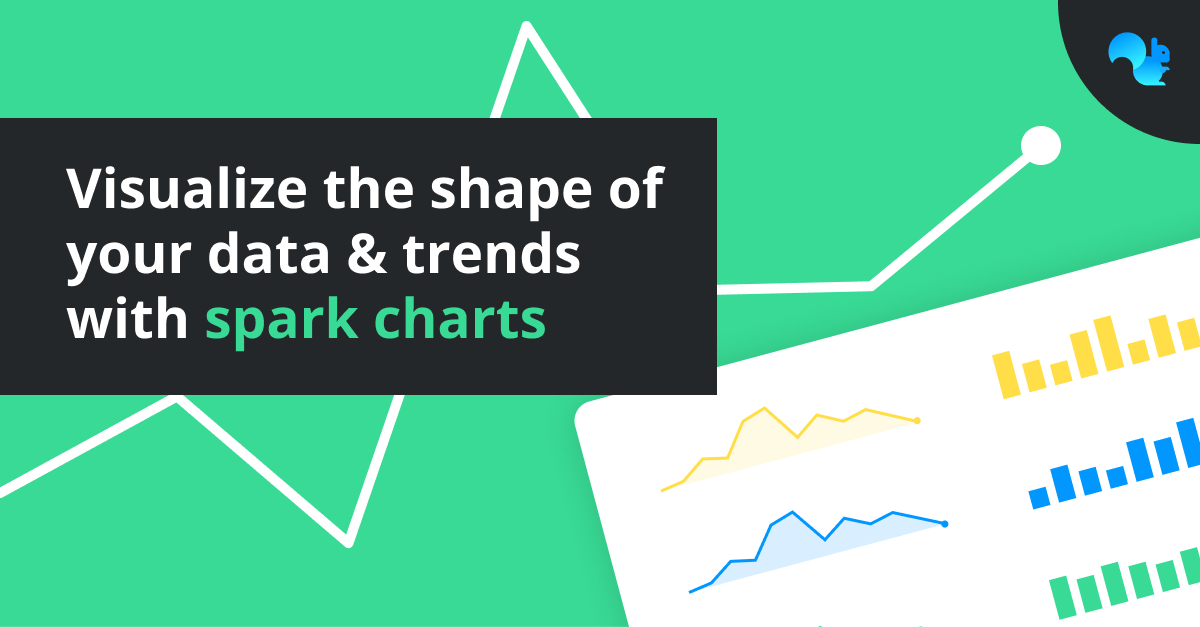
Sparkcharts can showcase a streamlined representation of your data and display alongside your project inputs and analytics. This can be useful for immediate analysis of trendlines and data flows over a period, or for seeing the rise and fall of data in comparison to previous inputs.
To build this, its simply a case of binding the chart Data to the values you want to display, set the colours, and choose the line style from the following options:
1. Line
2. Smoothed Line
3. Column
4. Area
5. Smoothed Area